Performance management is a crucial aspect of any successful business, involving the regular assessment and tracking of employee performance to ensure alignment with organizational goals. While many sophisticated tools and platforms exist, Excel remains a choice for performance management due to its flexibility and accessibility. This blog post will guide you through the process of managing performance using Excel, highlighting its capabilities and challenges.
Section 1: Why Use Excel for Performance Management?
Excel offers several benefits for performance management:
- Flexibility: Customize spreadsheets to fit specific needs.
- Accessibility: Widely available and easy to use.
- Cost-Effective: Often included in existing software packages without additional cost.
Section 2: Setting Up Your Excel Spreadsheet
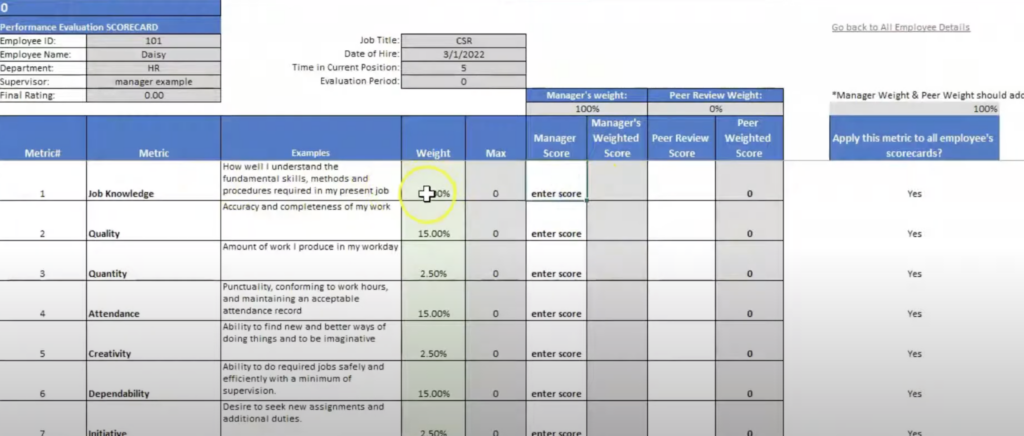
1. Define Your Performance Metrics
Start by identifying key performance indicators (KPIs) that reflect your business objectives. Common KPIs include sales targets, customer satisfaction scores, and project completion rates.
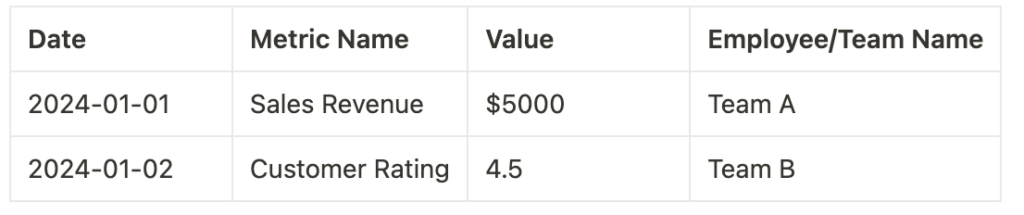
2. Create a Data Input Sheet
Set up a dedicated sheet for inputting raw data. Organize data with columns for:
- Date
- Metric Name
- Values
- Employee/Team Name
Example:
3. Design a Dashboard Sheet
Create a summary dashboard to visualize performance metrics using charts, graphs, and conditional formatting. This sheet should provide a quick overview of key trends and insights.
Section 3: Using Formulas and Functions
1. Basic Formulas
Use basic Excel formulas such as SUM, AVERAGE, and COUNT to aggregate data and calculate KPIs.
Example:
- Total Sales:
=SUM(B2:B10) - Average Rating:
=AVERAGE(C2:C10)
2. Advanced Functions
Leverage advanced functions like VLOOKUP, INDEX/MATCH, and IF statements to manage and analyze data more efficiently.
Example:
- Lookup Sales Value:
=VLOOKUP("Sales Revenue", A2:C10, 2, FALSE)
Section 4: Automating Performance Tracking
1. Setting Up Conditional Formatting
Use conditional formatting to highlight performance thresholds and variances. For instance, you can color-code cells based on performance levels.
2. Creating Automated Alerts
Set up automated alerts using conditional formatting and rules to flag performance issues automatically.
Section 5: Visualizing Data with Charts and Graphs
1. Creating Bar and Line Charts
Use bar and line charts to visualize performance trends over time. Include step-by-step instructions with screenshots.
2. Using Pivot Tables
Create and use pivot tables for dynamic data analysis, summarizing and filtering performance data.
Section 6: Best Practices for Performance Management in Excel
1. Regular Updates and Reviews
Regularly update the spreadsheet and review performance data. Schedule regular check-ins and data refreshes.
2. Maintaining Data Integrity
Ensure data accuracy and consistency by validating data inputs and using data protection features.
The Challenges of Using Excel for Performance Management
While Excel is a powerful tool, managing performance in Excel can be complex and time-consuming. Here are some challenges you might face:
- Manual Data Entry: Requires significant time and effort to input and update data.
- Error-Prone: High risk of human error in data entry and calculations.
- Limited Scalability: Difficult to manage large datasets or complex performance metrics.
- Lack of Real-Time Updates: No real-time data tracking, leading to potential delays in decision-making.
The Better Alternative: Using a Performance Management Platform
To overcome these challenges and boost productivity, consider using a dedicated performance management platform like ConectoHub. Here’s how ConectoHub can enhance your performance management process:
- Automated Data Collection: Eliminate manual data entry with automated data collection from various sources.
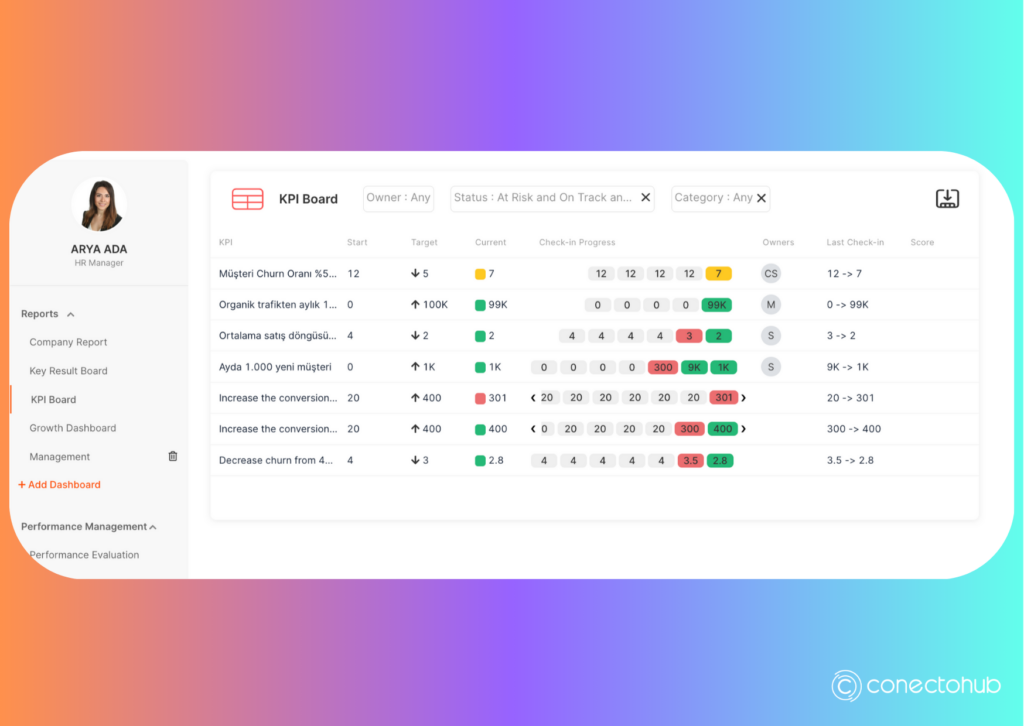
- Real-Time Analytics: Access real-time performance data and analytics for quicker decision-making.
- Scalability: Easily manage large datasets and complex performance metrics.
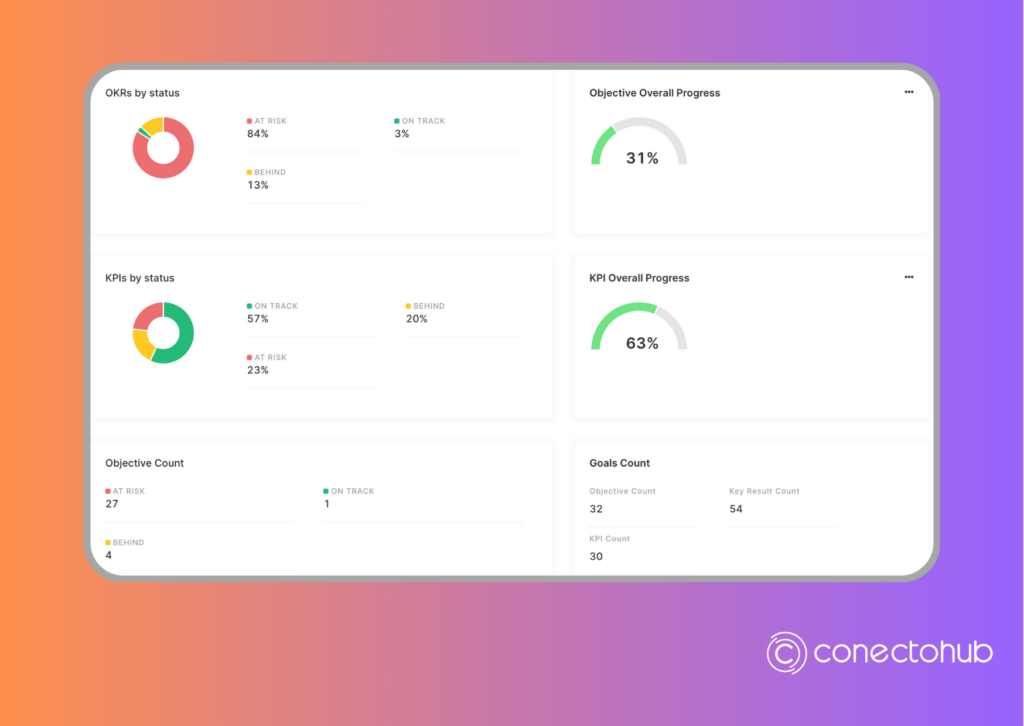
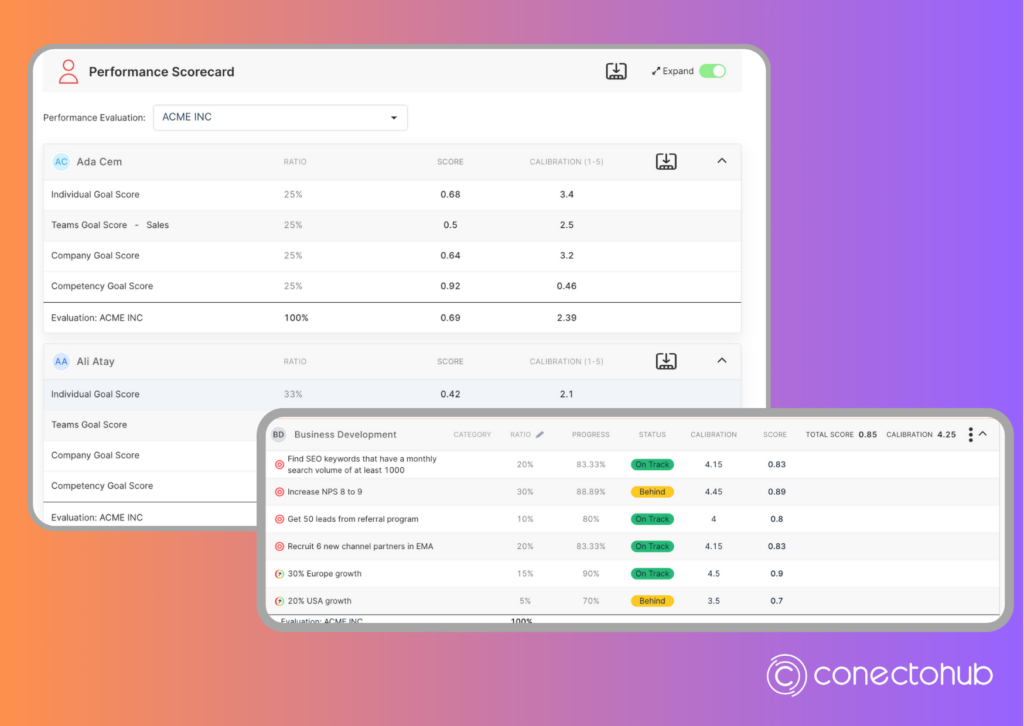
- User-Friendly Dashboards: Intuitive dashboards that provide clear and actionable insights.
- Collaboration Tools: Enhance team collaboration with integrated communication and feedback features.

By transitioning to a performance management platform, you can save time, reduce errors, and gain deeper insights into your business performance. Ready to take your performance management to the next level? Try ConectoHub today and experience the difference!
To achieve scalable growth, it is essential to have the ability to collect, view, and analyze all relevant data in one centralized location. ConectoHub prioritizes providing a comprehensive solution that empowers fast-growing companies to manage all aspects of their operations and people management from a single platform. With ConectoHub, you can gain instant insights into every detail of your company.
Ready to take your company’s growth to the next level? Experience the transformative power of ConectoHub today and streamline your performance and work management processes. Don’t miss out—start your free trial now and see the difference ConectoHub can make!