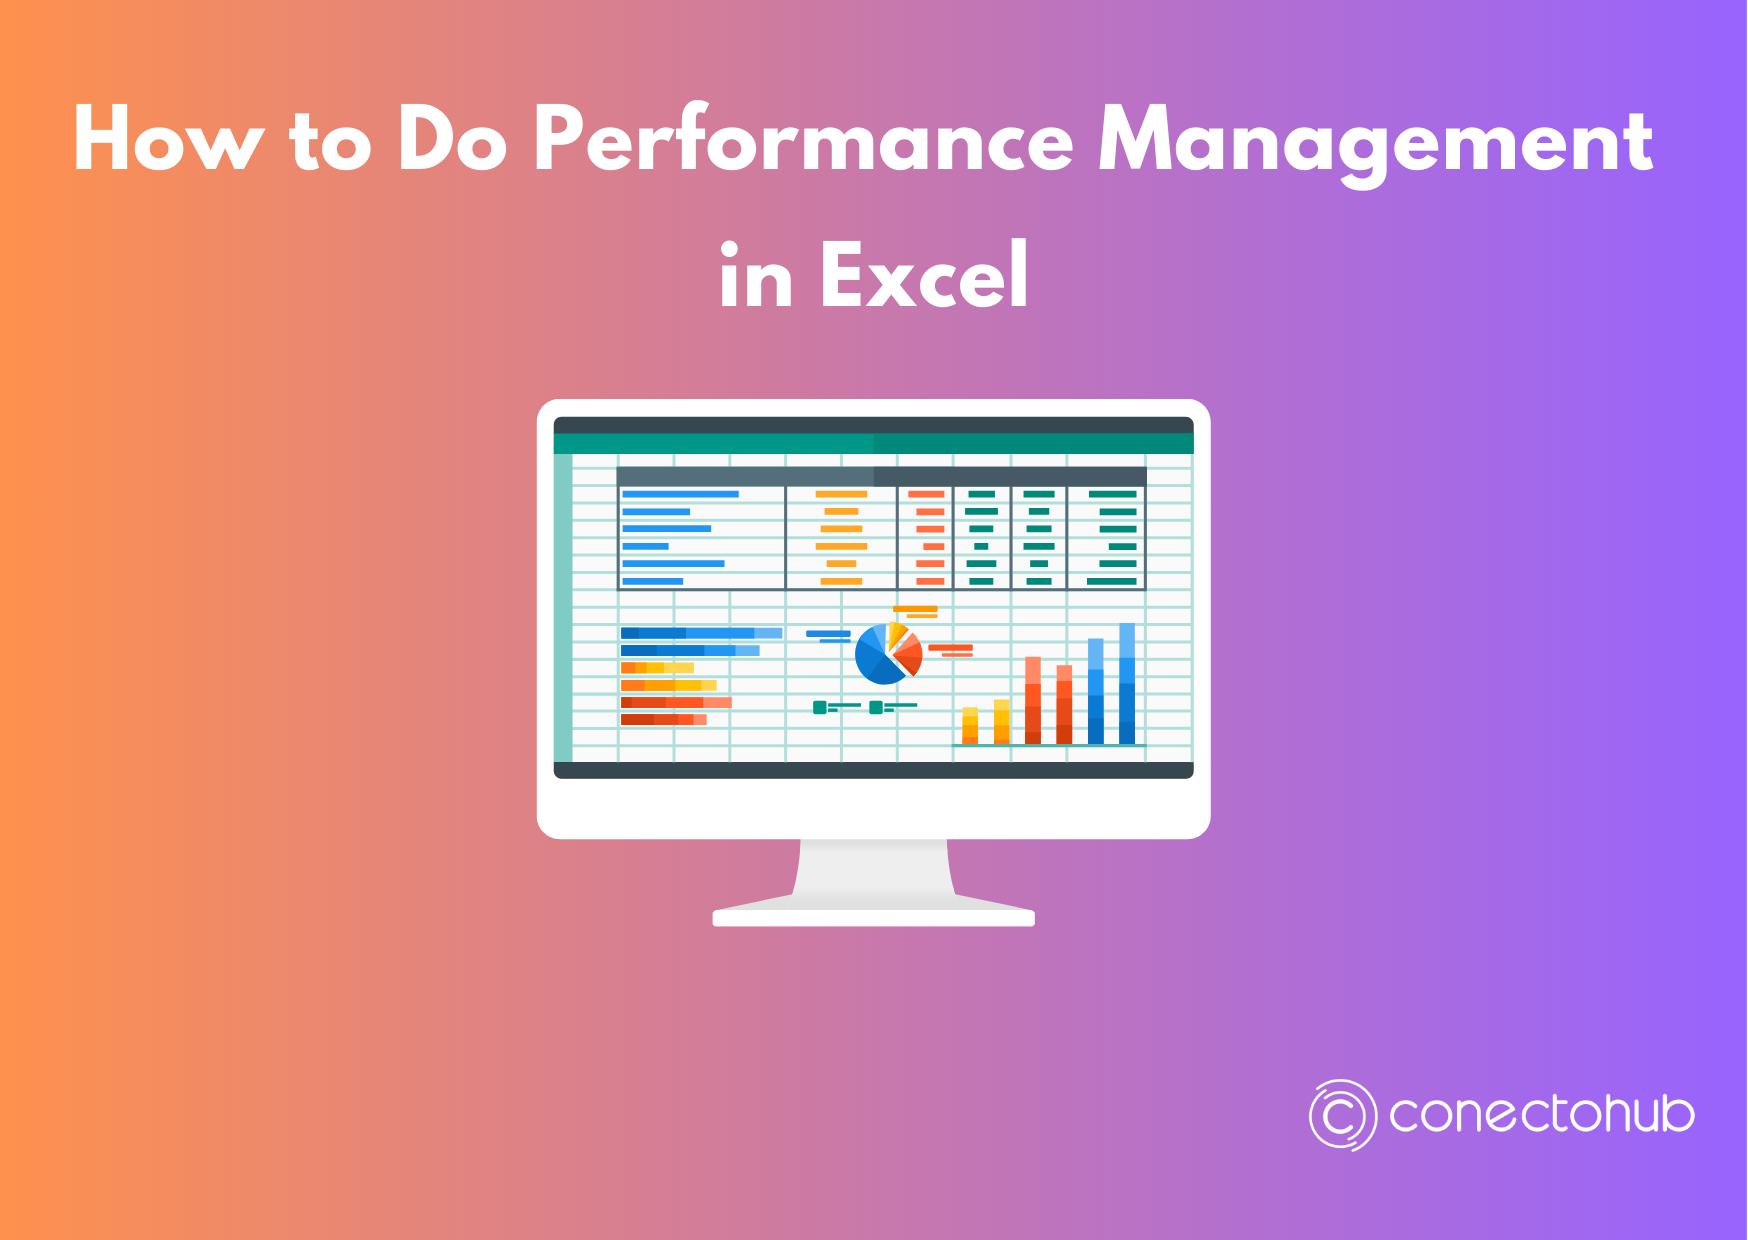
Performance management is a crucial aspect of any successful business, involving the regular assessment and tracking of employee performance to ensure alignment with organizational goals. While many sophisticated tools and platforms exist, Excel remains a choice for performance management due … Read More
The average annual revenue generated from each customer contract is the Annual Contract Value (ACV). If a customer signs a 5-year contract for $500,000, the ACV would be $100,000.
 ACV FORMULA
TOTAL CONTRACT VALUE (excluding one-time fees) TOTAL YEARS IN CONTRACT
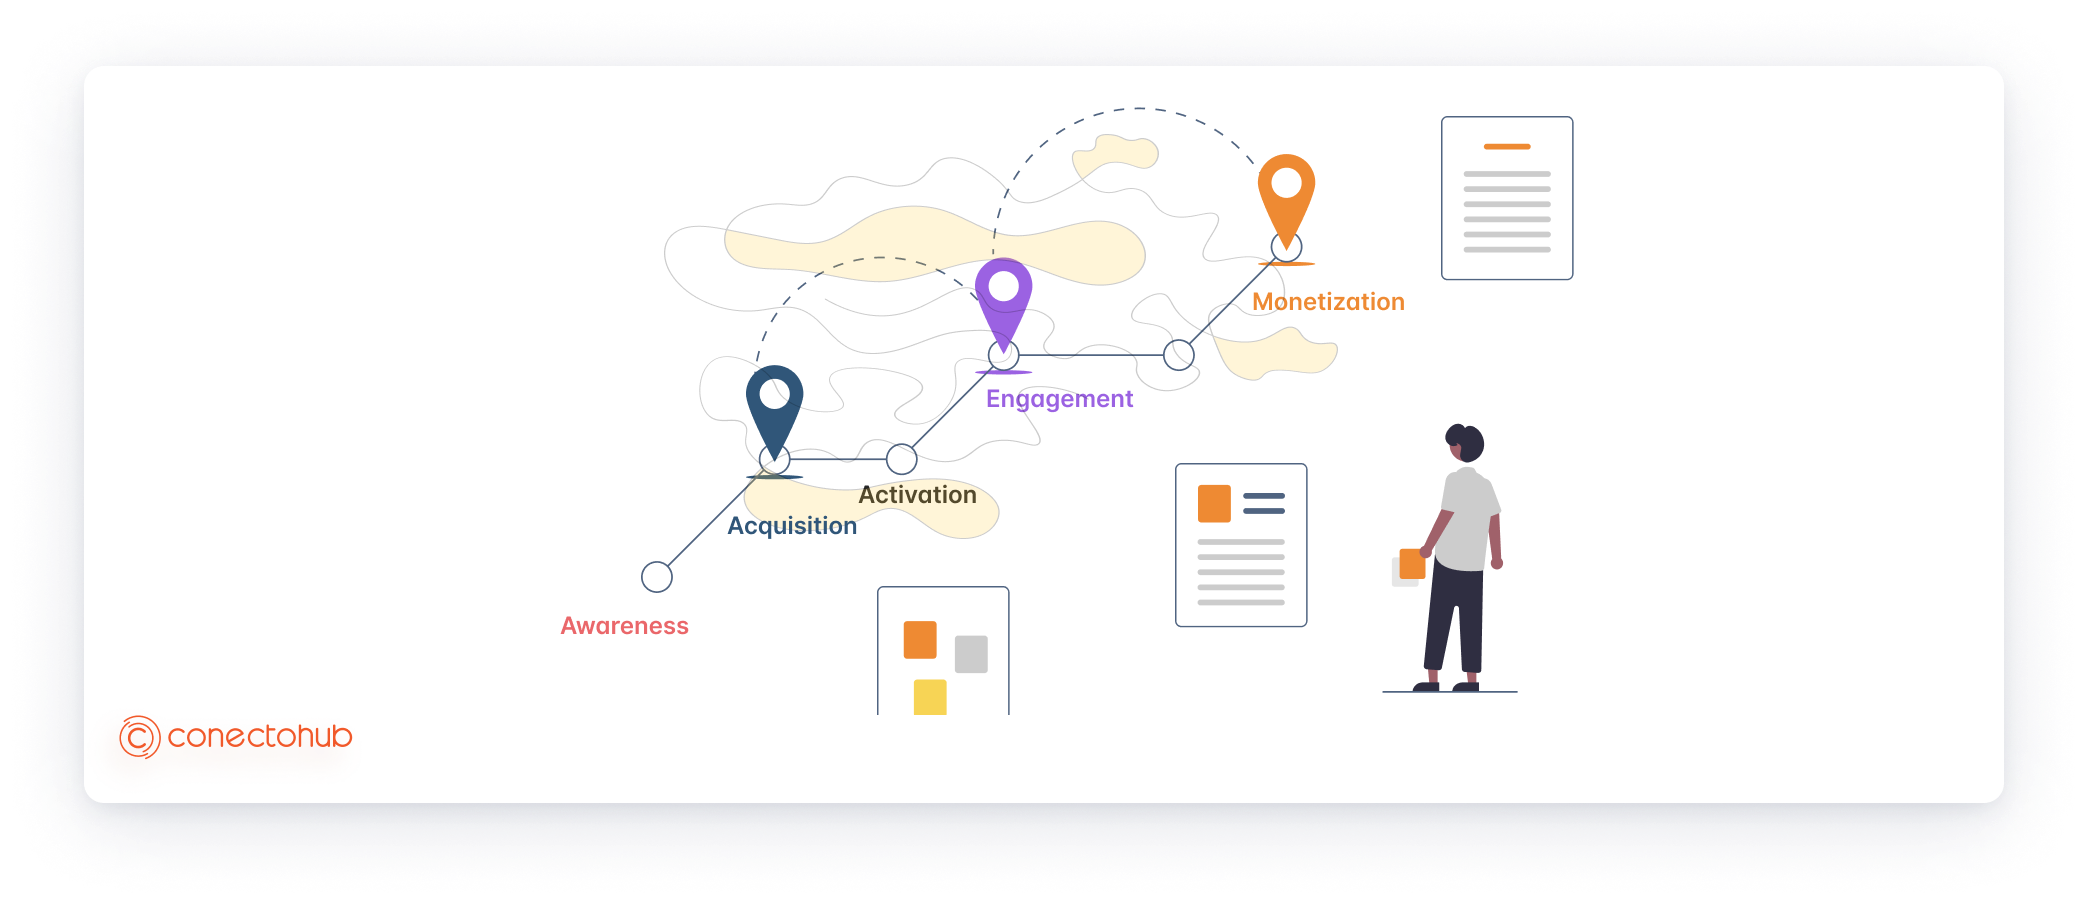
Activation Rate helps companies determine how quickly and effectively their new users are achieving perceived value. It measures the number of new users that have performed a predetermined “key action” within a set period of time, where the key action is assumed or known to deliver initial customer value.
 ACTIVATION RATE FORMULA
#ACTIVATED USERS / #TOTAL USERS IN PERIOD
The ARR metric is a way to measure the recurring revenue that a customer has with a company over the course of a 12-month period. This metric is most commonly used by software as a service (SaaS) businesses and other subscription-based businesses that have a minimum contract duration of 12 months. The ARR metric is calculated in different ways depending on the type of contract, but the basic math is relatively simple.
ARR FORMULA
#AVERAGE REVENUE PER ACCOUNT  #TOTAL ACCOUNTS THAT MONTH
Average Selling Price (ASP) is the average price a given product is sold for. This metric can be applied narrowly to a product or service or, more broadly, to an entire market. It’s a common metric, often used to compare businesses or channels and is particularly interesting as a reflection of what consumers will pay for similar products or services.
ASP FORMULA
#REVENUE / #SALES COUNT
The burn rate is typically used to describe the rate at which a new company is spending its venture capital to finance overhead before generating positive cash flow from operations. It is a measure of negative cash flow.
BURN RATE FORMULA
(Starting Balance – Ending Balance) / # MONTHS
Customer Acquisition Cost
Especially for SaaS companies, it is a metric that identifies new customers and calculates how much these customers will cost. Thanks to this metric, SaaS companies can calculate how their customers will affect their company budget. CAC is usually figured for a specific time range, such as a year , a month (it changes according to companies).
CAC needs to be more explained. To give an example, let’s say you own a company. Your company needs new customers. So, how can you use the CAC metric?
 The new customers you have acquired and the costs of the activities you spend and perform for these customers (sales, advertising, marketing) are related to CAC. For example, you have 5000 new customers and you have spent $5000 for sales and marketing activities for these customers .Then, we can ask this question: How much will it cost your company to acquire new customers? You can answer this question with the CAC metric!
CAC FORMULA
#NEW CUSTOMERS (Number Of People)  #Sales,advertising, marketing costs for new customers
Close Rate is the percentage of Leads who entered the sales funnel and are now “Closed Won” Customers. This is one of the most ubiquitous sales conversion metrics and is a strong indication of product market fit, pricing, and sales execution. It’s also a key metric in aligning your marketing, sales, and product teams.
Close Rate FORMULA
#WON CUSTOMERS / #TOTAL LEADS
Call-in Rate is the average number of inbound calls received per paid user of a product or service. It is used to monitor changes in call volumes, which can be an early warning sign of product or service issues, and even potential churn.
CIR FORMULA
#INBOUND CALLS / #PAID USERS
Trial Conversion Rate measures the percentage of users that have converted to a paid account from a trial period. Commonly referred to as Free Trial to Paid Conversion Rate, this metric indicates product value by measuring the number of users that find enough value in the product to pay for it. Trial Conversion Rates vary based on the type of trial you use. In SaaS, the standard practice is to either have a freemium product or a free trial period that usually spans a couple weeks.
CONVERSION FORMULA
#CONVERTED USERS / #TOTAL USERS IN PERIOD
You have customers using an application that you use or make for your company. But, are all these customers unique users who are really active in your product?
You can use DAU (Daily Active Users) and MAU (Monthly Active Users) metrics to answer this question.
The DAU metric is a key performance indicator for many online businesses and SaaS companies. This metric stands for Daily Active Users (DAU) and represents the number of unique users who visit your site or use your app each day.
Similarly, the MAU metric stands for Monthly Active Users (MAU) and represents the number of unique users who visit your site or use your app monthly. The MAU metric is calculated on a monthly basis and to find the MAU metric, you must divide the total DAU by the number of days in the month.
 Product stickiness is called the DAU to MAU ratio, a measure of how often customers return to your app!
MAU FORMULA #TOTAL DAU #NUMBER OF THE DAYS IN THE MONTH
Earnings Before Interest, Taxes, Depreciation, and Amortization (EBITDA) is one of a few profit metrics. At its simplest, EBITDA focuses only on operational profitability, ignoring non-cash expenses by adding them back to Net Income.
EBITDA FORMULA
GROSS REVENUE – OPEX
Employee Net Promoter Score (eNPS) is a method built around the Net Promoter Score (NPS) to measure employee loyalty. It measures how willing your employees are to recommend their workplace to their family or friends.
eNPS is calculated using the following formula: eNPS = percentage of Promoters minus percentage of Detractors. The result can range from -100 to +100.
eNPS FORMULA
%PROMOTERS – % DETRACTORS
An ‘employee turnover rate’ refers to the percentage of employees who leave an organization during a certain period of time.
TURNOVER FORMULA
#EMPLOYEES WHO LEFT / #AVG NUMBER OF EMPLOYEES
Lifetime Value (LTV) metric indicates the total revenue a business can reasonably expect from a single customer account. It considers a customer’s revenue value and compares that number to the company’s predicted customer lifespan. Businesses use this metric to identify their most valuable customer segments.
LTV FORMULA
AVG MRR PER USER x CUSTOMER LIFETIME
The term MRR stands for monthly recurring revenue. This is a measure of the predictable revenue that a business can expect to earn each month. The most important metric for financial growth is MRR.
MRR FORMULA
#NUMBER OF SUBSCRIBERS UNDER A MONTHLY PLAN #THE AVERAGE REVENUE PER USER (ARPU)
Renewal Rate is measure of retention, expressed as a percentage.
MRR Renewal Rate is a rate of renewal of MRR, a normalized revenue number assigned to recurring revenue transactions.
RENEWAL FORMULA
#CONVERTED USERS / #TOTAL USERS IN PERIOD
A Marketing Qualified Lead (MQL) is a universal metric used by marketing teams to measure the quality of leads they generate and pass to sales. Most marketing teams have targets associated with MQLs that include number of MQLs and acceptance rate, for example, leads that go on to become Sales Accepted Leads.
MQL FORMULA
#MQL
A Sales Qualified Lead (SQL) is a prospect that meets certain conditions as defined by the sales process. SQLs are middle of the funnel, having been qualified first by marketing or a lead setting team, and are now ready to be moved to the next stage in the sales process
SQL FORMULA
#SQL
Product Qualified Leads (PQL) measures the quality of potential customers by classifying them according to their actions and usage within the product platform.
PQL FORMULA
#PQLs
Retention Rate calculates the proportion of customers in a particular period that are retained into the next period.
RETENTION FORMULA
(#Customers End of Period – #Acquired Customers) / #Customers Beginning of Period
Sales Cycle is the count of the number of days or months it takes on average to close a deal. This metric can be helpful when creating sales forecasts, measuring sales efficiency, and speaking with investors. It is often referred to as the Average Deal Cycle and is usually expressed in months.
SALES CYCLE FORMULA
#TOTAL SALES DAYS / #TOTAL SALES COUNT
Churn rate, also known as attrition rate, is a business metric that calculates the rate at which customers leave a product over a given period of time. Signup churn is an important indicator of product adoption and activation.
SIGNUP CHURN RATE FORMULA
#SIGNUP CHURN / #TOTAL SIGNUPS IN PERIOD
Time to Fill is the amount of time it takes a Human Resources Team to fill an open position. It can indicate where HR teams can make process improvements. It can also demonstrate changes in the hiring market.
TTV FORMULA
#DAYS TO FILL OPEN ROLES / #TOTAL HIRED EMPLOYEES
Time to Value (TTV) measures the duration between when a user selects your product and the moment they initially realize the value of your product. Value usually means that the setup process is completed and the first usage of the product is successful.
TTV FORMULA
#CONVERTED USERS / #TOTAL USERS IN PERIOD
Stratejik İnsan Kaynakları Yönetimi
Stratejik İnsan Kaynakları Yönetimi organizasyonların çalışanlarını yönetmek için kullandıkları bir süreçtir. Organizasyonun insan kaynaklarının, organizasyonun hedeflerini destekleyecek şekilde kullanılmasını sağlama yoludur. Bunu, insan kaynakları ile şirketin hedefleri arasında bir köprü olarak düşünebilirsiniz. Stratejik İnsan Kaynakları Yönetimi ile işletmeler, çalışan performansı … Read More
Supercharge Your Team: Best OKR Examples
In today’s fast-paced business world, setting clear and achievable goals is more important than ever. Objectives and Key Results (OKRs) offer a dynamic framework for setting these goals, enabling organizations of all sizes to achieve remarkable success. Whether you’re a … Read More